Welcome to Specification Insights
Welcome to the Specification Insights feature on E1! This guide will help you understand how to use Specification Insights to gain valuable insights into the trends in the performance of your brands, products, and competitors in the market.
Video guide
You can watch a short video guide here:
What is Specification Insights?
Specification Insights uses your saved Speci-Finder keywords to aggregate on-demand insights about the trends in the specification performance of your brands, products, and competitors in the market. The data is presented via a suite of easy-to-interpret charts.
Accessing Specification Insights
Specification Insights is available to supplier customers with a Professional Plus subscription.
- Login to Your Account:
- Go to the E1 website and log in with your account credentials.
- Navigate to Specification Insights:
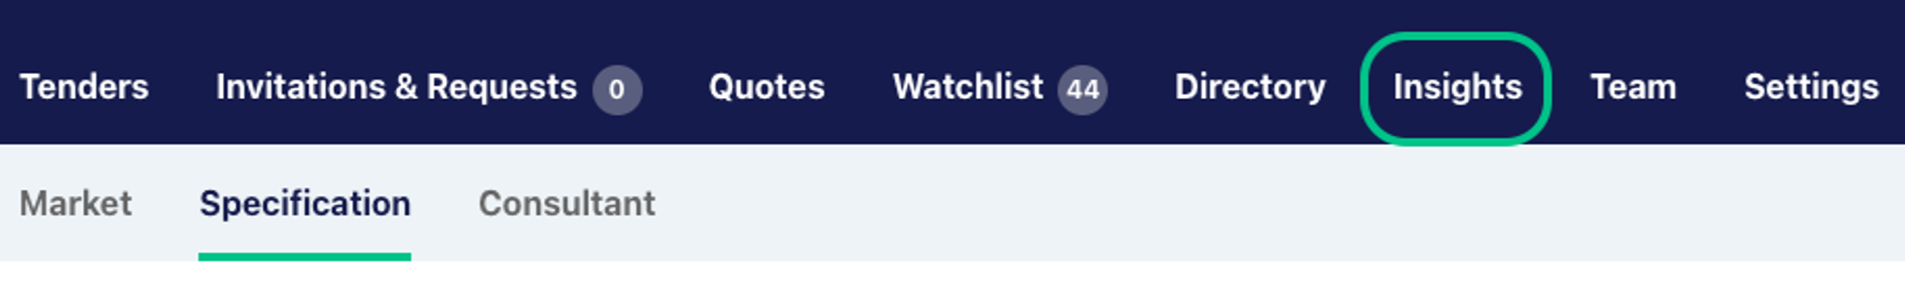
- Once logged in, navigate to the Insights tab. Under the Insights tab, click on Specification to access the Specification Insights dashboard.
Creating your report
The Specification Insights dashboard provides comprehensive data on the performance of your brands and products. Here’s how to build your report:
Report criteria - Brand or Product section
This is where you can select from up to 4 Speci-Finder keywords for your report. Typically these would be your brand, your competitor/s or generic terms for products you supply.
You can refine you report selections by location of project (national or individual states) and by project category.
For example, you might run a report with your brand at a national level in the first section, then your brand and individual states to see how they compare. Or you might compare a competitor by state, or at a national level in emerging project categories.
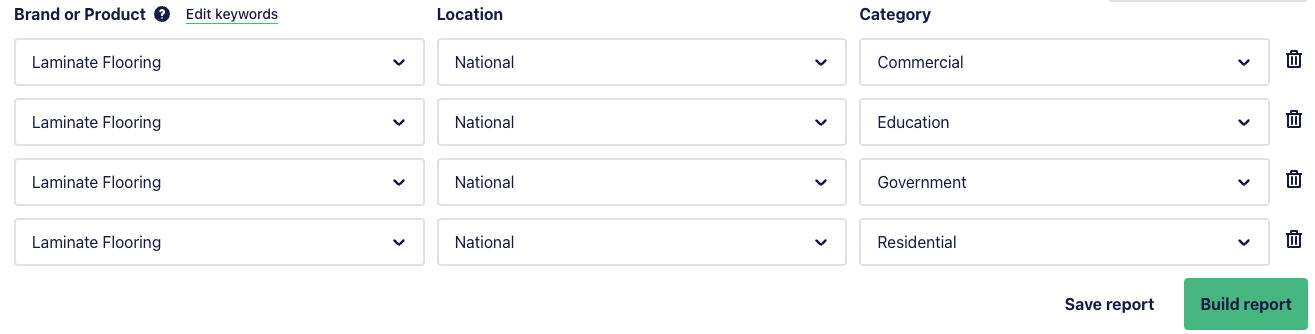
Once you’re happy with your selections, click ‘Build report’.
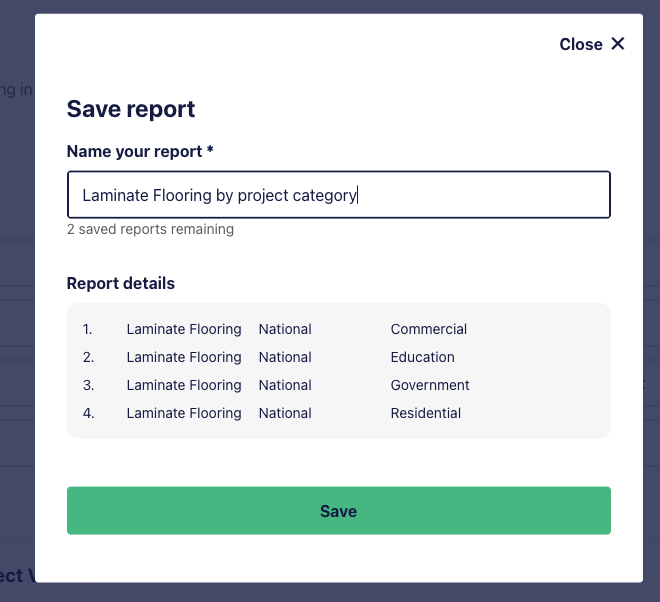
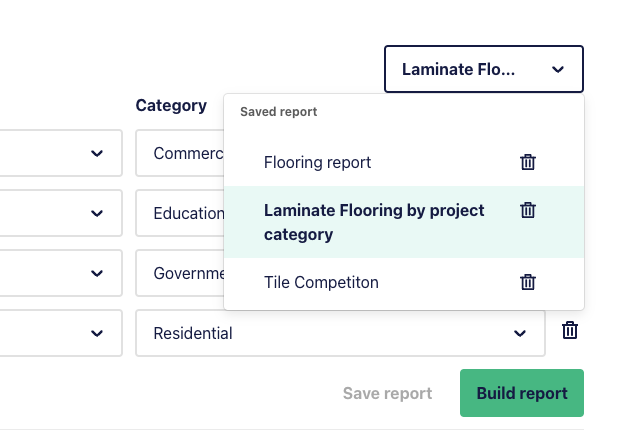
You can also save your criteria for reports you run frequently (up to 5 saved reports) by clicking ‘Save report’ and naming the version.
It will then be available to select and re-run from the ‘Saved Reports’ section
Understanding the Dashboard
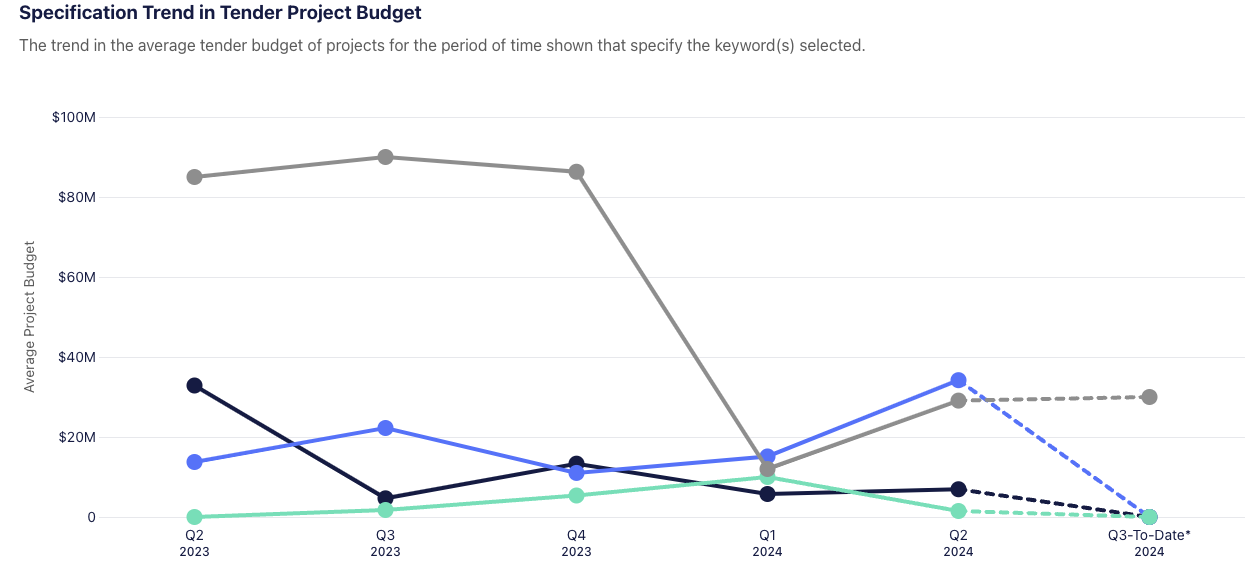
Once you’ve clicked ‘Build report’, you’ll see two charts, one for project volumes and one for project budgets.
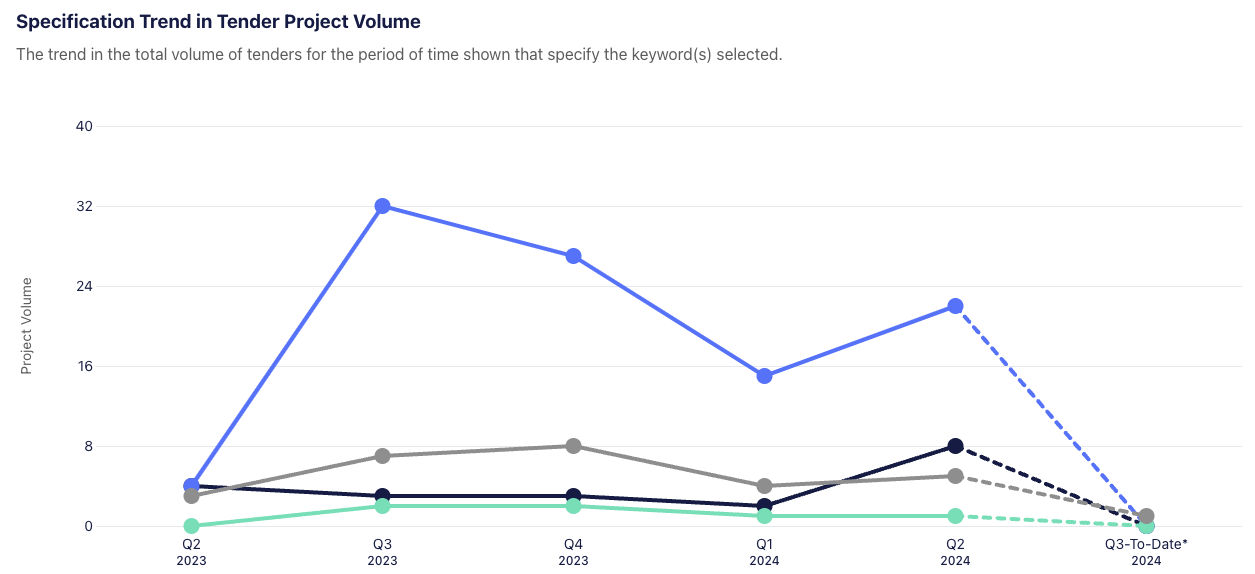
Each keyword is represented by a coloured line graph, and the metrics are per calendar quarter for the past 5 quarters, and a 6th data point reflecting the current quarter to date.
Hovering over the data points reveals the specific project volumes for each data criteria (e.g. number of projects with laminate flooring in the nominated location and project category for the quarter).
The Specification Trend in Tender Project Budget report is operated in the same way, but instead of project volumes, it will show average project values. The graphs will often look quite different, and project values may reveal segments of opportunity for greater sale value.
You can drill down further into the detailed list of projects that make up the data points by hovering over the dots on the chart and selecting ‘view projects’.
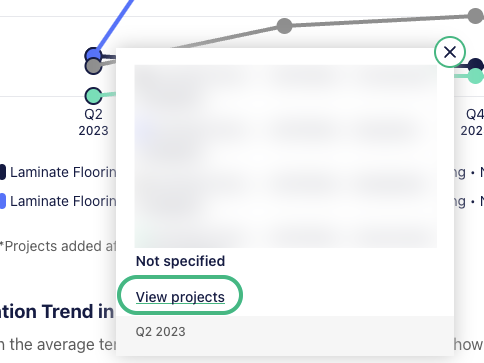
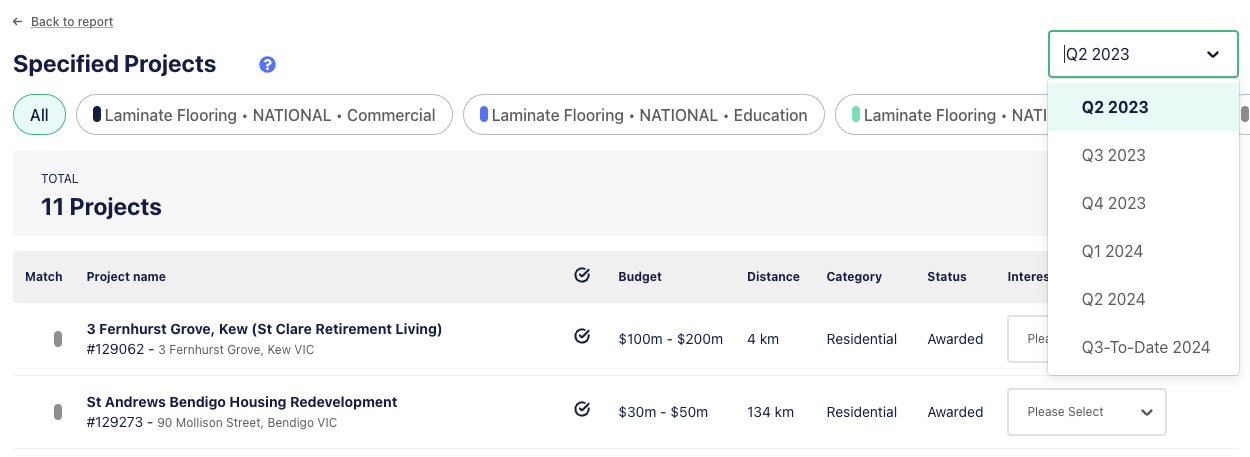
You’ll be presented with a list of projects, and can click through to the detailed view of that project by clicking on the project name.
You can also toggle between reporting periods via the drop down menu in the top right corner.
Using Specification Insights
- Monitor & Assess Market Conditions:
- Explore how the commercial tender market is performing quarter on quarter in terms of tender volumes and budgets at a national, state, and category level.
- Track Specification Performance:
- Understand if your business development efforts are leading to increased specifications of your brands/products and compare this performance to the market and competitors.
- Identify Opportunities:
- Identify opportunities for new growth or diversification by assessing specifications by location and market segment.
- Inform Sales Strategy:
- Use data to inform business decisions and measure the impact of changes in business, marketing, product, or sales strategy.
- Action Opportunities:
- Identify projects, builders, and consultants you need to engage with to maximise business opportunities.
Setting Up Speci-Finder Keywords
The Specification Insights feature utilises your Speci-Finder keywords to create your reports. You can add to or change these at any time.
- Create Keywords:
- In the Specification Insights tab, click on Create Keywords.

- Add your 'keyword' and 'keyword type' (brand, competitor, product, other).

Data Source and Access
- Data Source:
- Specification Insights utilises information from all the public commercial tenders listed on the E1 platform, based on information provided by builders.
- Access:
- Specification Insights is available as part of the Professional Plus license. This license gives you access to both Specification and Market Insights products, including five quarters of data.
- Inviting Colleagues:
- Any existing E1 users on your account can view Specification Insights if your company has access. You can add additional users by clicking on the Invite to Insights button.